
Figure 4.
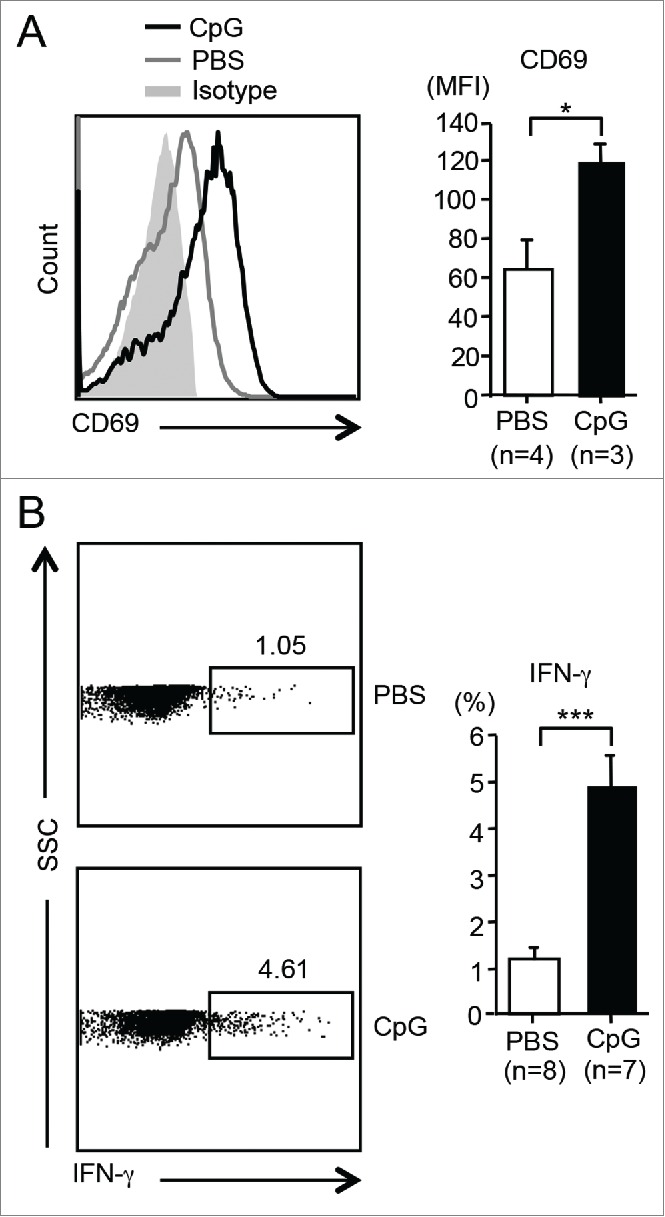
CpG ODN can activate HJ1 T cells in vivo. HJ1Tg/hCD1Tg/Rag−/− mice were injected (i.v.) with either 40 μg (in 100 μL PBS) of CpG or PBS. Twelve hours later, the activation and cytokine production of hepatic HJ1 T cells was determined by flow cytometry. (A) Representative histograms show the expression of CD69 on HJ1 T cells from CpG ODN-injected (black line) or PBS-injected mice (gray line). Gray solid area indicates isotype control. To the right, CD69 expression, on HJ1 T cells in PBS (open bar) or CpG ODN (black bar) injected mice, is depicted in bar graphs. Error bars represent mean ± SEM of the mean fluorescence intensity of CD69. (B) Representative dot-plots of IFNγ-producing HJ1 T cells in the PBS or CpG ODN-injected HJ1Tg/hCD1Tg/Rag−/− mice (left). Bar graphs (right) depict IFNγ secretion by HJ1 T cells upon PBS (open bar) and CpG ODN (black bar) injection. Mean ± SEM is shown for the bar graphs. ***p < 0.005; **p < 0.01; *p < 0.05.