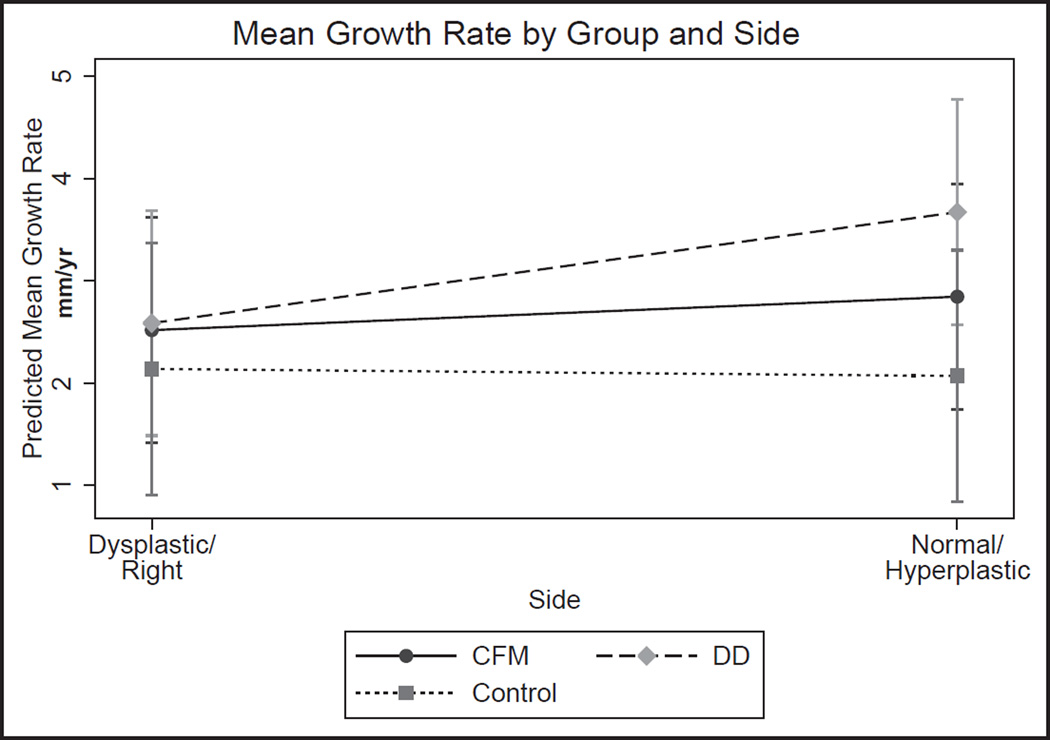
Fig 6.
Predicted mean growth rate by side. Overall differences in the predicted growth rate between sides of the mandible are shown for the CFM group, the dentofacial deformity group (DD), and the control. Measurements are averaged over all regions on the particular side of the mandible. In the CFM group, the dysplastic side shows an overall lower mean growth rate than the “normal” side. In the dentofacial deformity group, the hyperplastic side has the overall highest mean growth rate and the greatest difference between sides. A detectable but statistically insignificant difference in growth rate was measured in the control group.

