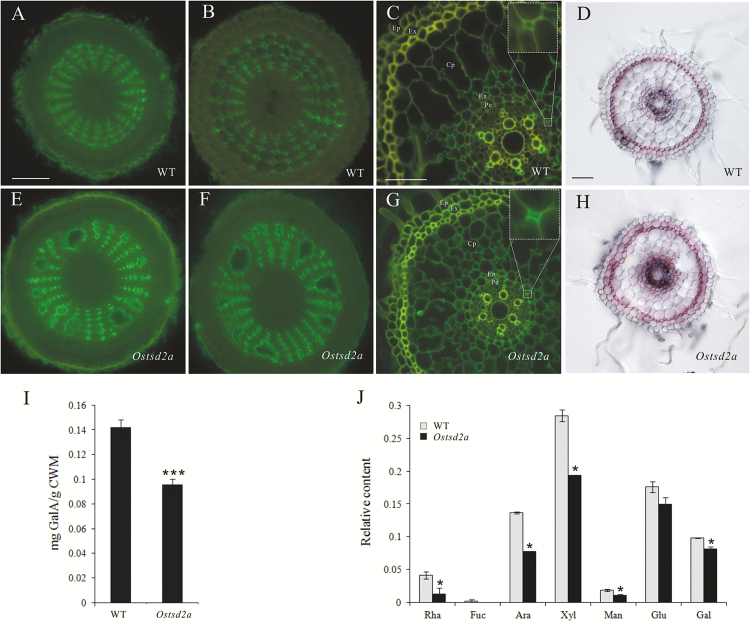
Fig. 5.
Changes in HG methylesterification patterns and content of pectin in Ostsd2a mutants. (A–C, E–G) Immunofluorescent detection of HG methylesterification patterns using the monoclonal antibody LM19. All samples were embedded and sectioned transversely at 10 μm thickness. All sections were incubated with the monoclonal antibody LM19 and then the secondary antibody conjugated to FITC. The control (with LM19 omitted) is shown in Supplementary Fig. S5. Scale bars are 50 μm (shown in A for A, B, E, F; shown in D for D, H) and 25 μm (shown in C for C, G). (A, E) Sections of the meristematic zone, (B, F) sections of the elongation zone, and (C, G) sections of the maturation zone. The insets in (C, G) show close-ups of the intercellular corners between pericycle cells (Pe) and the neighboring endoderm cells (En). Other abbreviations: Ep, epidermis; Ex, exodermis; Cp, cortex parenchyma. (D, H) Ruthenium Red staining. Transverse sections of the differentiation zone were acquired by use of a vibratome and stained with 0.02% Ruthenium Red. Obvious staining mainly occurs in the exodermis of both lines. Scale bar = 50 μm. (I) Content of GalA in the pectin of the cell walls of the seedling. (J) Relative content of monosaccharide composition in pectin extracted from seedlings according to the peak area detected by GC-MS. Abbreviations: Rha, rhamnose; Fuc, fucose; Ara, arabinose; Xyl, xylose; Man, mannose; Glu, glucose; Gal, galactose. Reuslts of Student’s t-test: *, P<0.1; **, P<0.001. (This figure is available in color at JXB online.)

