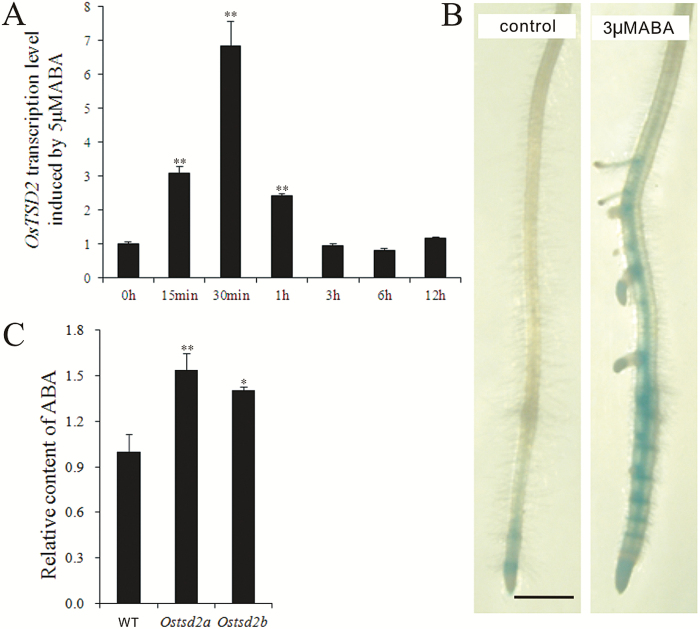
Fig. 6.
ABA inducement on OsTSD2 transcription and relative content of endogenous ABA. (A) Relative transcription level of OsTSD2 induced by exogenous 5μM ABA over time (min, minute; h, hour). The values were standardized according to the endogenous control gene OsUBI and the value at 0h is expressed as 1. (B) Expression of OsTSD2 in the primary root tip of the proOsTSD2:GUS transformed line without (left, control) and with (right) previous treatment with exogenous 3μM ABA. Scale bar = 1mm. (C) Relative content of endogenous ABA in roots of WT, Ostsd2a, and Ostsd2b plants according to the peak area detected by LC-ESI-MS/MS. Results of Student’s t-test: *, P<0.05; **, P<0.01. (This figure is available in color at JXB online.)

