Fig. 1.
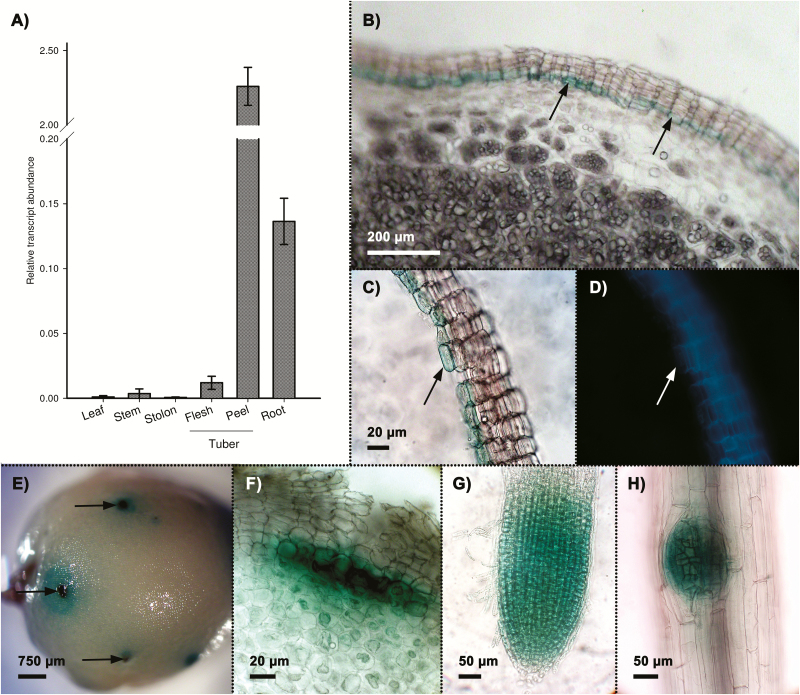
StNAC103 transcript accumulation and promoter activity in potato native tissues. (A) Transcript abundance in different potato organs and tissues. Relative mRNA expression levels were expressed as the mean ±SD (the biological replicates were four for stem, leaf, and root, three for stolon and parenchyma, and two for phellem). (B–F) StNAC103 promoter activity in ProStNAC103:GUS-GFP tuber. (B) Section of a tuber showing GUS staining specific to the inner phellem cell layers (arrows). (C) Sheet of mechanically isolated phellem showing the GUS blue marker and the (D) suberin autofluorescence. (E) The GUS signal observed through the tuber surface showing lenticels as dark blue dots (arrows). (F) Detail of a lenticel seen in cross-section showing the GUS blue marker located to the lenticular phellogen. (G, H) Root whole mounts showing the GUS signal localized in (G) apical and (H) lateral root meristems.

