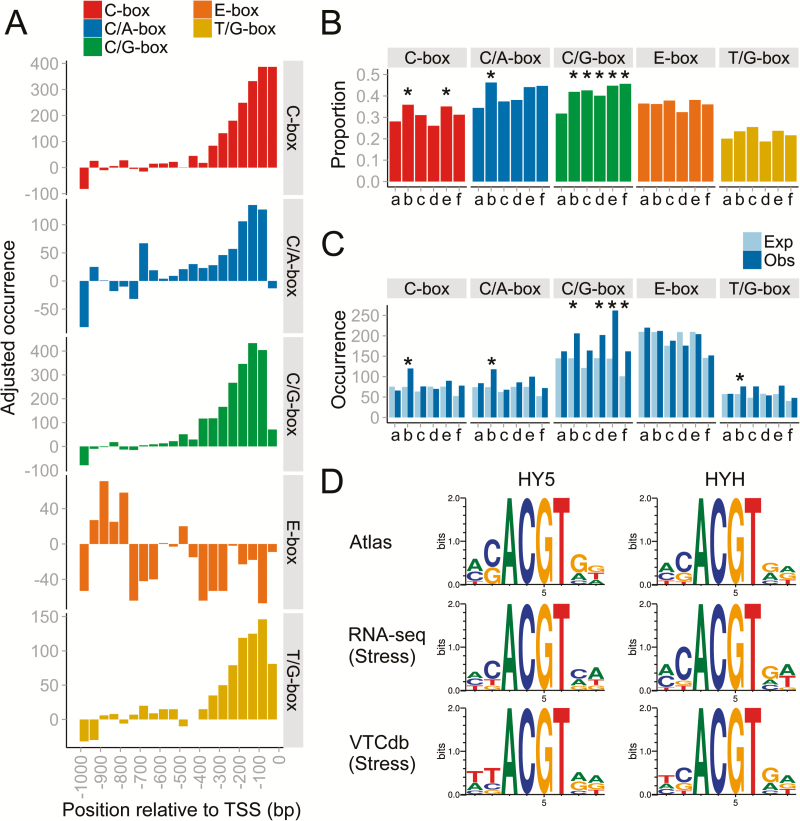
Fig. 4.
Genome-wide analysis of predicted HY5 and UV-B response cis-regulatory elements (CREs) in grapevine promoters. (A) Distribution plots of HY5 and UV-B response CREs in grapevine promoters (1kb upstream of the TSS). Each bin represents the total motif occurrence in 50 promoter bases, adjusted for the baseline occurrence (average motif occurrence between the –500 and –1000bp region). The baselines of the C-box, C/A-box, C/G-box, E-box, and T/G-box are 490, 798, 600, 709, and 333, respectively. Motif Z-scores for the C-box, C/A-box, C/G-box, E-box, and T/G-box are 6.4, 1.6, 5.8, –0.7, and 2.9 respectively. (B) Frequencies (in proportion) of highly co-expressed genes with HY5 and HYH inferred from various data sets (atlas, stress-related RNA-seq, and stress-related VTCdb) containing the relevant CRE in their promoter region. Strong enrichment of the CRE based on the differences in proportions following a hypergeometric distribution is indicated as * (P<0.01). (C) The total number of CRE occurrences (Obs) in promoter regions of HY5 and HYH co-expressed genes and randomized promoters of similar size (Exp). Statistically significant CRE observations at P<0.01 (based on 1000 permutations) are indicated by asterisks. (D) The sequence logo for grapevine HY5 and HYH inferred from degenerate binding sites enriched in various data sets. a, HY5 (Atlas); b, HY5 (Stress RNA-seq); c HY5 (Stress VTCdb); d, HYH (Atlas); e, HYH (Stress RNA-seq); f, HYH (Stress VTCdb). (This figure is available in colour at JXB online.)

