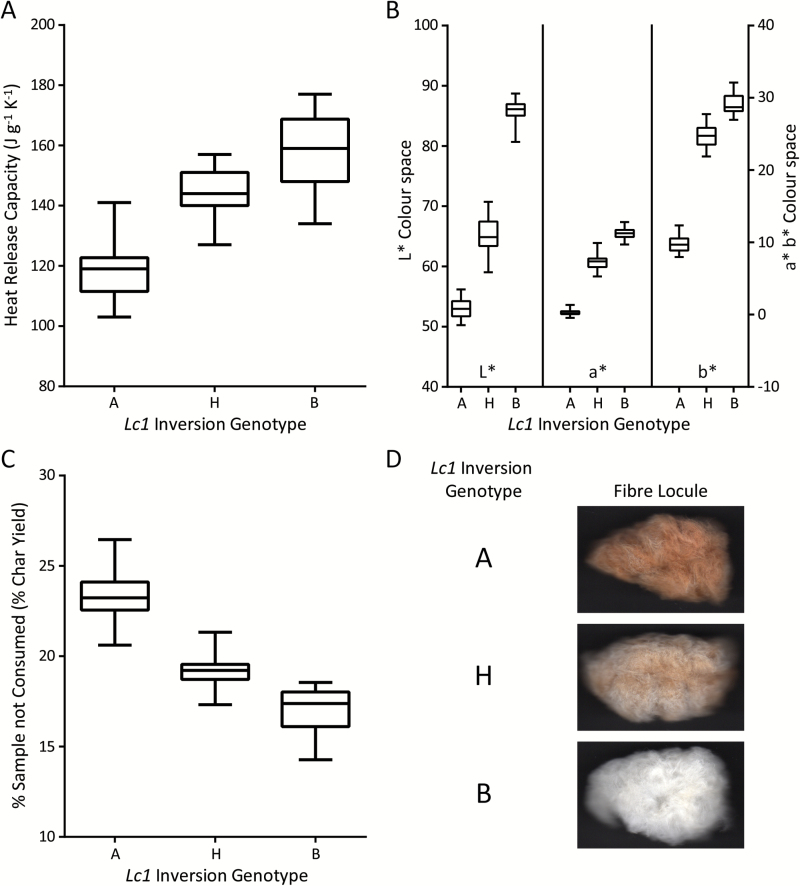
Fig. 4.
Correlations between CIE L*a*b* colour space and fibre flammability (heat release capacity) in a subset of the F2 segregating population. A lower HRC indicated a more flame retardant material. Whisker bars represent the maximum and minimum of three measurements. (A) Heat release capacity increased in order from homozygous Lc1 fibres (A genotype) to heterozygous Lc1 fibres (H phenotype) to homozygous wild-type (B genotype). (B) The CIE L*a*b* colour space coordinated with increased HRC starting with dark brown fibres (A genotype) to light brown fibres (H genotype) to white wild-type fibres (B genotype). (C) Percentage of sample not consumed (% char yield), which indicates the level of inorganic material remaining after pyrolysis, decreased in order from homozygous Lc1 fibres (A genotype) to heterozygous Lc1 fibres (H phenotype) to homozygous wild-type (B genotype). (D) Scanned images of single locules representative of the indicated Lc1 inversion genotype. In CIE L*a*b* colour space, L* indicates whiteness (0=black; 100=white); a* indicates colours from greenish (negative values) to reddish (positive values); and b* indicates colours from bluish (negative values) to yellowish (positive values).

