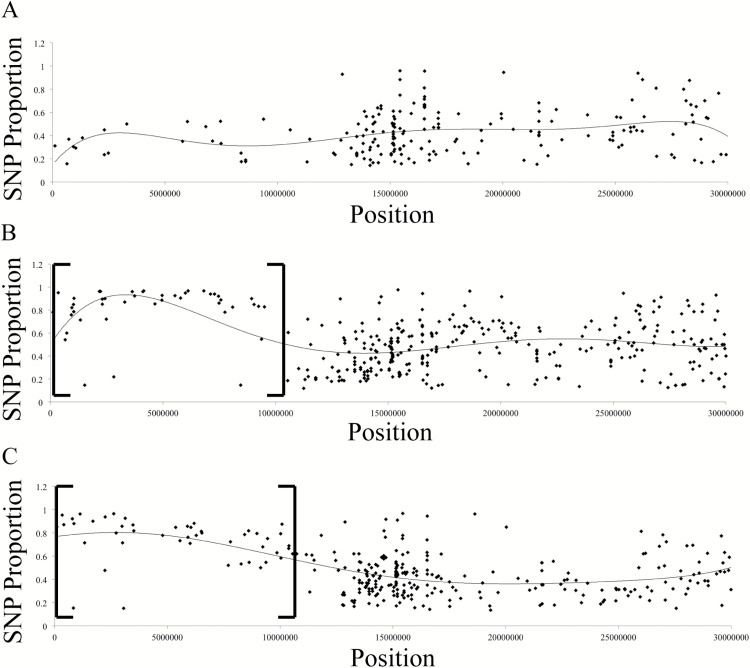
Fig. 2.
Genome sequencing of suppressor lines 1.6 and 3.3. Proportion of reads containing SNPs on chromosome 1 for (A) pool of non-suppressed individuals from a line 1.6 backcross, (B) pool of suppressed individuals from a line 1.6 backcross, and (C) pool of suppressed individuals from a line 3.3 backcross. Brackets indicate the region on chromosome 1 with a higher overall SNP Proportion that is linked to the suppressor phenotype.

