
Figure 3.
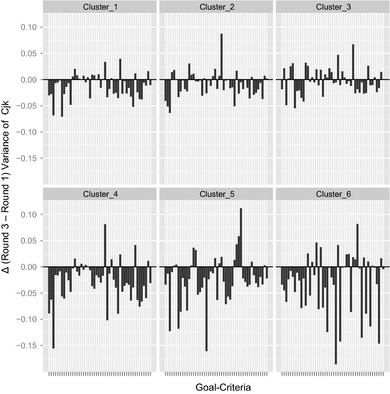
Average group agreement by cluster. This figure presents posterior mean value for the Round 3 variance in participant beliefs within each cluster minus the Round 1 variance among such participants for each combination of suicide prevention research goal and rating criterion. A smaller variance among participants indicates a relatively greater agreement among participants as compared to a larger variance. Each bar in a plot panel represents the difference in variance among raters for a particular goal criterion, and each chart panel includes all goals for raters in a cluster. A negative value for a bar within a cluster plot panel indicates a by‐round shift among stakeholders towards agreement. The longer the bar, the larger the shift to agreement is.