
Figure 1.
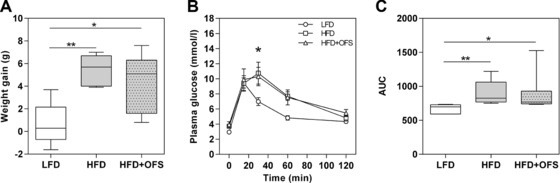
Weight gain and glucose tolerance of conventional mice. Weight gain (A), oral glucose tolerance (B), and total area under the curve (AUC) (C) of conventional C3H mice after five weeks on semisynthetic diets: low fat diet (○ LFD), high fat diet (□ HFD), and high fat diet supplemented with oligofructose (∆HFD + OFS). Data of weight gain and AUC during glucose tolerance test are expressed as medians. Boxes show the 25–75, whiskers the 5–95 percentile (*p < 0.05, **p < 0.01). Plasma glucose data are expressed as means with their standard errors (*p < 0.05, LFD versus HFD + OFS). n = 5–7 per dietary group.