
Figure 3.
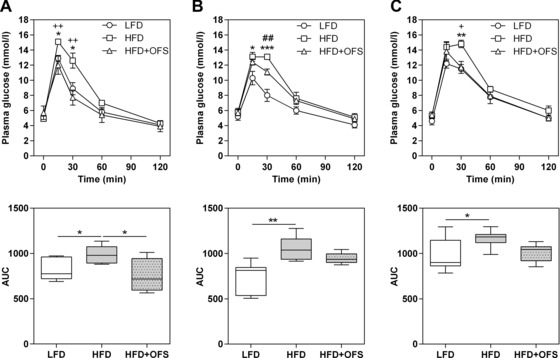
Glucose tolerance test in gnotobiotic mice. Plasma glucose (mmol/L) following an oral glucose load (2 g/kg body weight, 200 g/L glucose) in germfree (A), SIHUMI (B), and SIHUMI‐Bif mice (C) fed one of these semisynthetic diets: low fat diet (○ LFD), high fat diet (□ HFD), and high fat diet supplemented with oligofructose (∆ HFD + OFS). Plasma glucose data are expressed as means with their standard errors (*p < 0.05, **p < 0.01, ***p < 0.001, LFD versus HFD; ## p < 0.01, LFD versus HFD + OFS; + p < 0.05, ++ p < 0.01, HFD versus HFD + OFS). Box plots represent the total area under the curve (AUC) for each dataset. Data are expressed as medians. Boxes show the 25–75, whiskers the 5–95 percentile (**p < 0.01, ***p < 0.001). n = 5–7 per dietary group, except for germfree mice fed OFS (n = 4).