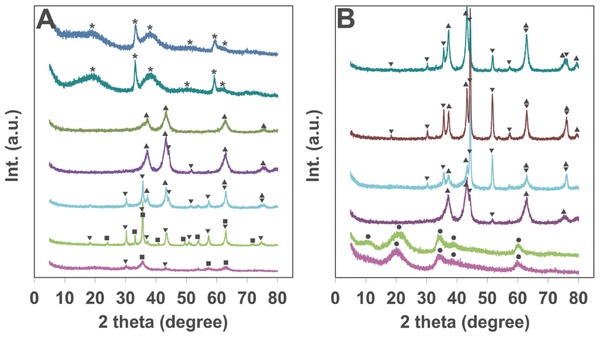
Figure 1.

A) XRD patterns of the Ni‐X‐200 samples (X from bottom to top: 50, 70, 80, 85, 90, 98, 100); B) XRD patterns of the Ni‐85‐Y samples (Y from bottom to top: rt, 100, 200, 300, 400, 500). ●: α‐Ni(OH)2, *: β‐Ni(OH)2, ▴: NiO, ▾: NiFe2O4, ◼: γ‐Fe2O3.
