Figure 8.

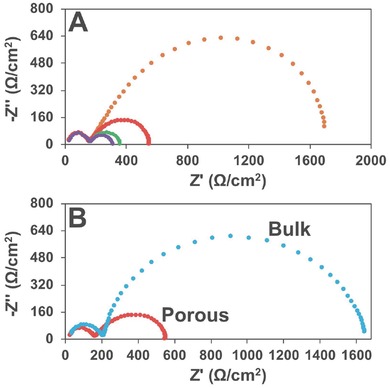
A) EIS Nyquist plots of Ni‐85‐200 under different potentials (yellow: 1.52 V; red: 1.57 V; green: 1.62 V; purple: 1.67 V). B) EIS Nyquist plots of Ni‐85‐200 (red) and corresponding bulk sample (blue) under 1.57 V.

A) EIS Nyquist plots of Ni‐85‐200 under different potentials (yellow: 1.52 V; red: 1.57 V; green: 1.62 V; purple: 1.67 V). B) EIS Nyquist plots of Ni‐85‐200 (red) and corresponding bulk sample (blue) under 1.57 V.