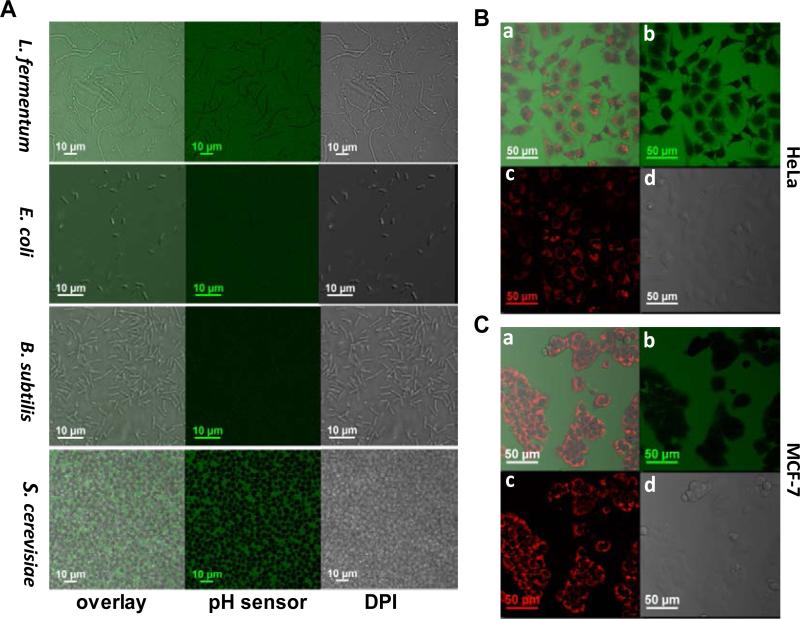
Figure 1.
Distribution of pH sensor (ps-pH-neutral) when it is incubated with microbes (panel A) and mammalian cells (panels B and C). Cells were not washed in order to show the background emissions and cells were not stained by the polymer. Green emission is from the polymer excited at 488 nm, red emission (image c in panels B and C) is from MitoTracker® Red. Image a is an overlay of image b (sensor), image c (MitoTracker) and image d (DPI) in panels B and C, respectively.

