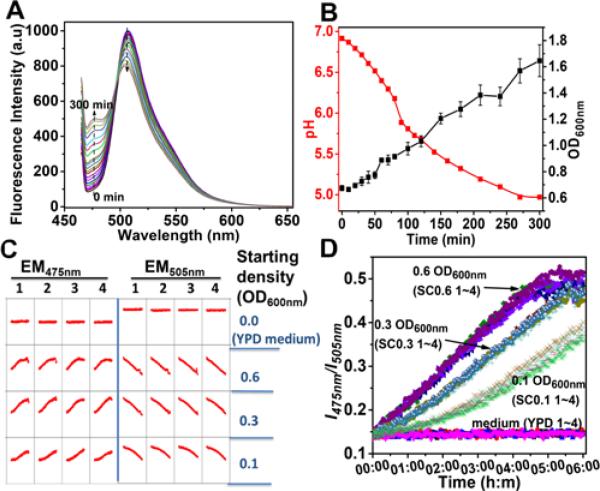
Figure 5.
Application of ps-pH-neutral in S. cerevisiae culture. A, fluorescence spectra of pH sensor were dynamically detected by spectrofluorophotometer under 455 nm excitation. B, growth curve of yeast and pH value which were transferred from data in A were plotted vs. incubation time in a cuvette. C, screen printing data from high throughput analysis of pH in yeast culture with microplate. D, plot curves of ratio values (I475nm/I505nm) from C vs. incubation time.

