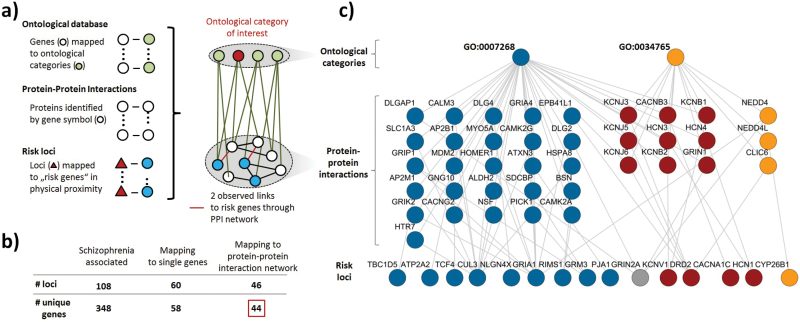
Fig. 1.
Overview of network based functional analysis. a) Schematic illustration of the network linking the PPI to ontological category information. b) Selection of the 44 loci mapping to single, unique genes with at least 1 link to the PPI network. c) Network illustration of the 2 significantly schizophrenia associated ontological categories “synaptic transmission” (GO:0007268) and “ion transmembrane transport” (GO:0034765). Nodes are colored depending on their predominant link to a given ontological category or its respectively associated proteins (red-colored proteins are shared between ontological categories and red-colored risk loci predominantly associated with such nodes).

