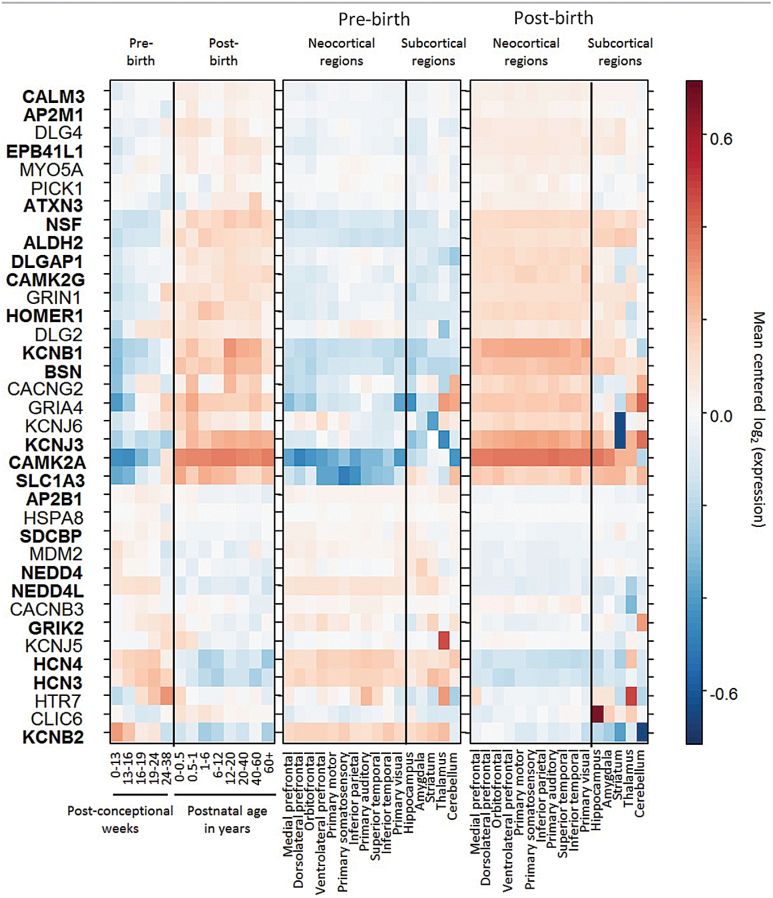
Fig. 2.
Gene expression patterns throughout development stages and across brain regions. Genes were ordered using complete linkage hierarchical clustering on the Euclidean distance of their expression levels. Genes shown in bold show significant change throughout developmental stages (Spearman correlation, False Discovery Rate [FDR] < 0.05). Graphical layout adapted from ref.6

