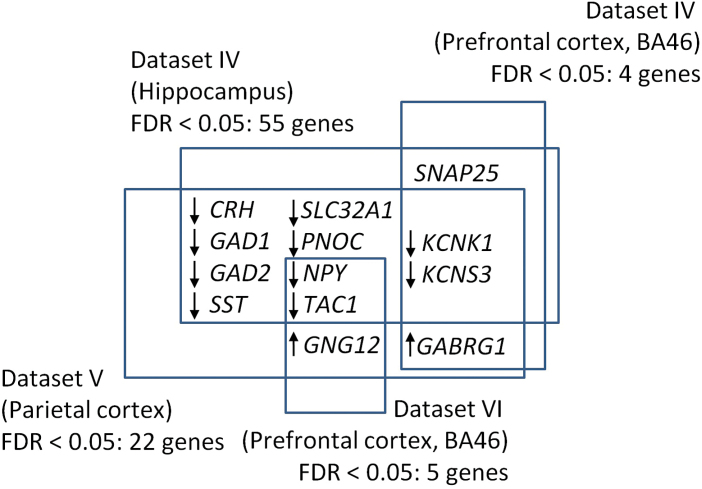
Fig. 3.
Overlap of significant expression differences across datasets. Displayed genes showed expression changes with P FDR < .05. Arrows indicate whether expression was consistently increased (up arrow) or decreased (down arrow) across the datasets where a significant change in a given gene was observed.

