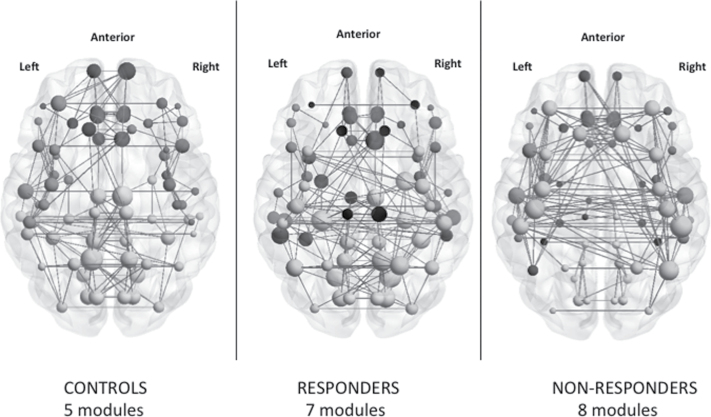
Fig. 3.
Graphical representation of gyrification connectomes. Connectomes in controls, Responders and Nonresponders are visualized using BrainNet viewer (www.nitrc.org/projects/bnv). The modules are color-coded separately for each network in the online version of this image. The size of the nodes is proportional to the nodal degree (number of edges) within each connectome.

