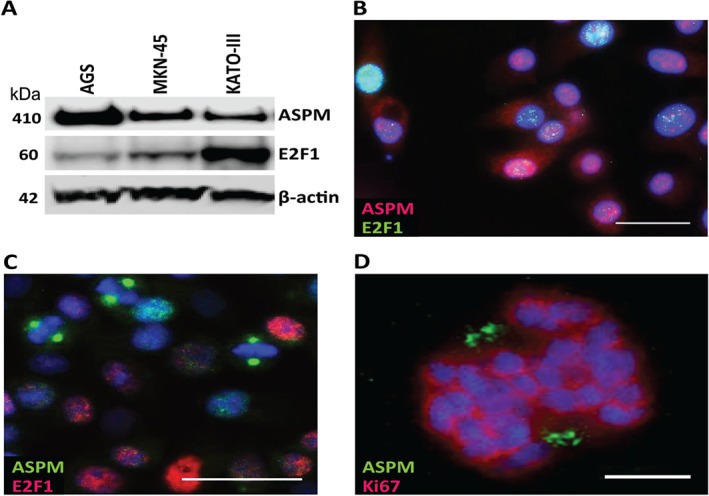
Figure 3.

ASPM and E2F1 expression in human gastric cancer cell lines. (A) Representative western blot (n = 4) of ASPM (full‐length) and E2F1 in the gastric cancer cell lines AGS, MKN‐45 and KATO‐III; β‐actin was used as loading control. (B) Immunocytochemical staining of MKN‐45 cells (n = 3), showing cytoplasmic and nuclear localization of ASPM (red; Millipore) and nuclear localization of the transcription factor E2F1 (green) in cells in interphase. (C) Immunocytochemical staining of MKN‐45 cells (n = 3), showing ASPM (green; Bethyl) condensed to the spindle poles in mitotic cells that do not seem to express E2F1 (red). (D) Confocal imaging showing ASPM (green) localized to the spindle poles during metaphase, as indicated by the position of Ki67 (red); nuclear DNA is stained with DAPI (blue). For the confocal image, DAPI, Alexa488 and Alexa647 were excited by 405, 500 and 640 nm laser lines and the fluorescence detected in the ranges 421–475, 510–564 and 653–711 nm, respectively. Sequential imaging was performed to minimize crosstalk. Deconvolution was performed using Huygens Professional software (v 143.06.1p3; Scientific Volume Imaging). Scale bars = (B, C) 25 µm; (D) 5 µm
