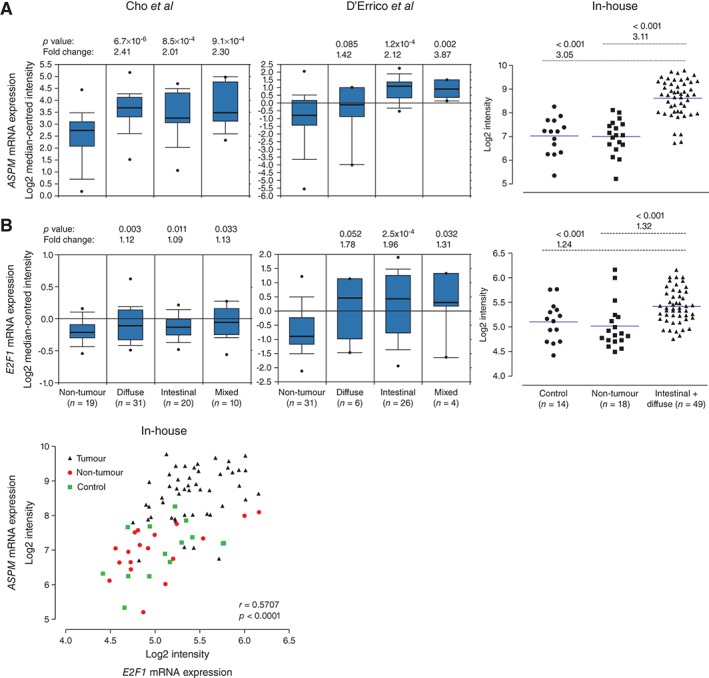
Figure 4.

Expression profile meta‐analysis of ASPM and E2F1 mRNA in human gastric adenocarcinomas, using Oncomine and in‐house datasets. (A) Cho et al
49 (ILMN_1815184 Illumina HumanWG‐6 v3.0), D'Errico et al
50 (reporter 232238, Human Genome U133 Plus 2.0 Array) and our in‐house gene expression datasets (ILMN_1815184 Illumina HumanHT‐12) showing increased expression of ASPM mRNA levels in human gastric adenocarcinomas of diffuse, intestinal and mixed type compared with non‐tumour gastric tissues. (B) Cho et al
49 (reporter; ILMN_12051469 Illumina Human WG‐6 v. 3.0), D'Errico et al
50 (reporter 204947, Human Genome U133 Plus 2.0 Array) and our in‐house gene expression datasets (ILMN_2051469 Illumina Human HT‐12), showing increased E2F1 mRNA levels in human gastric adenocarcinomas of diffuse, intestinal and mixed type compared to non‐tumour gastric tissues. (C) The mRNA expression levels of ASPM and E2F1 were significantly correlated in the in‐house gene expression dataset; fold changes, symbols, correlation coefficient (r) and p values are as specified in the figure. The Oncomine data show log2 median‐centred intensities, the box plots indicate median and 90% central range, and  represents maximum and minimum values. The symbols in the in‐house dataset represent individual mRNA expression levels (log2 intensities) in the designated groups, with the blue line indicating median
