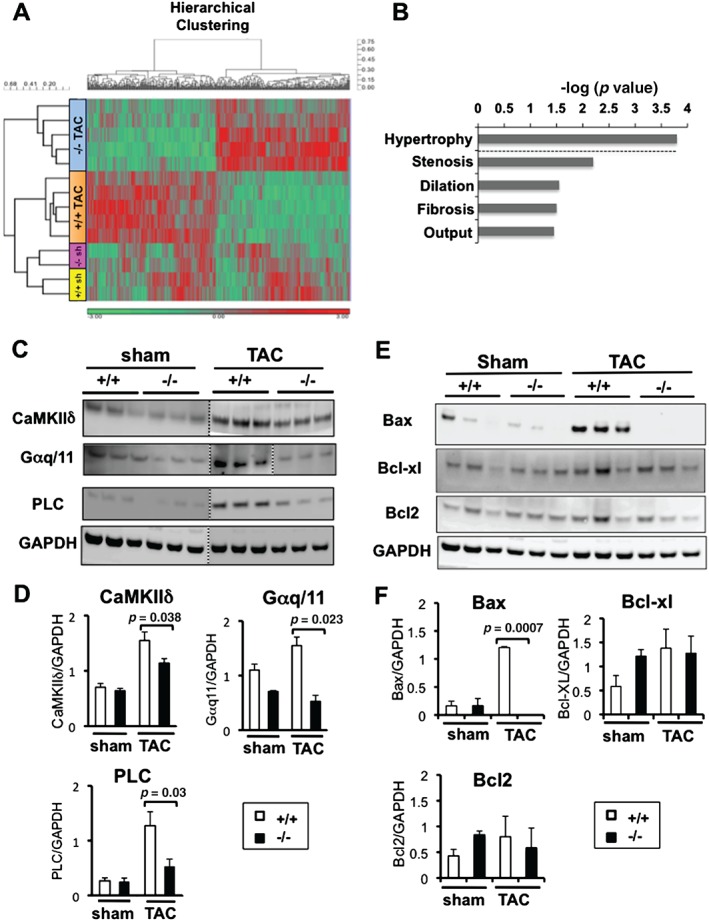
Figure 4.

Microarray analysis of Acp1+/+ and Acp1−/− mouse hearts after sham or TAC surgery. (A) Heat map showing the clustering of significantly dysregulated genes in Acp1−/− and Acp1+/+ mice after sham surgery (n = 2) or TAC (n = 5) (p < 0.01, 428 probes). Red colour indicates genes significantly up‐regulated, while green indicates genes significantly down‐regulated. (B) Major diseases and functions connected to genes dysregulated in Acp1+/+ TAC hearts compared with Acp1−/− TAC hearts. (C) Immunoblot of CaMKIIδ, Gαq/11, and PLC protein expression in Acp1−/− TAC hearts compared with Acp1+/+ TAC hearts. (D) Quantitative analysis of C over GAPDH control (n = 3–5). (E) Immunoblot of anti‐ and pro‐apoptotic proteins in Acp1−/− TAC hearts compared with Acp+/+ TAC hearts. (F) Quantitative analysis of E over GAPDH control (n = 3–5). Significant p values are shown (Student's t‐test).
