
Figure 2. Blood temperature, limb perfusion and oxygen uptake ( ) during combined leg and arm exercise .
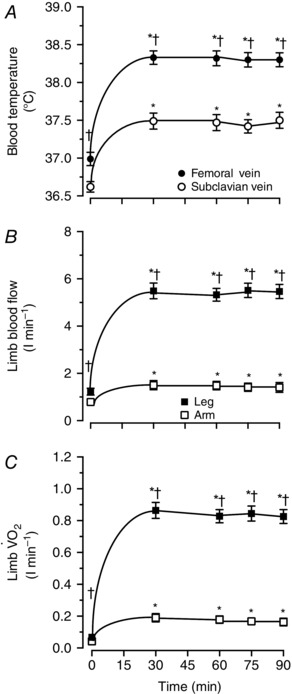
Blood temperature, limb blood flow and in the leg and arm during 90 min of moderate‐intensity constant‐load leg and arm cycling. A, blood temperature in the femoral and subclavian veins. B, limb blood flow in the leg and the arm. C, limb in the leg and the arm. Data are means ± SEM for 16 subjects. *Higher than 0 min baseline, P < 0.05. †Higher than arm values, P < 0.05.