
Figure 4. Blood temperature, limb perfusion and aerobic metabolism .
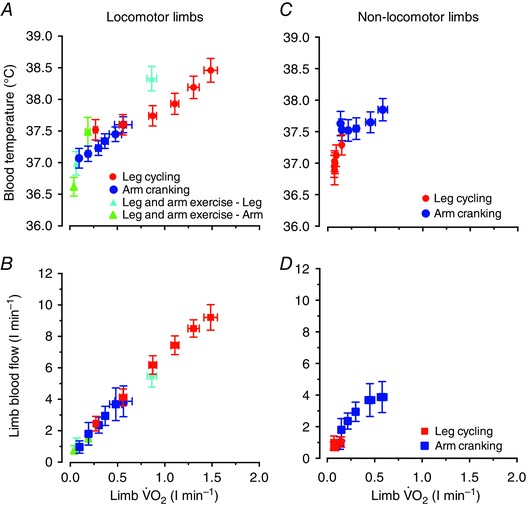
Relationships between blood temperature versus limb (A) and limb blood flow versus limb (B) at baseline and during incremental and prolonged leg and/or arm exercise (locomotor limbs graphs). The same relationships are also depicted for the non‐locomotor limbs during incremental leg cycling (i.e. the arms) and arm cranking (i.e. the legs; C and D). Data are the means ± 95% confidence interval for 15–16 participants. The relationship between T B and limb , established using linear regression analysis, was strong (A), particularly when focusing on the incremental leg‐cycling and arm‐cranking data (y = 0.90x + 37.04; r 2 = 0.95; P < 0.05). A correlation was also observed between limb perfusion and when including all data points from all the interventions (y = 5.97x + 0.64; r 2 = 0.99; P < 0.05; B). In the non‐locomotor limbs, the relationships between T B and limb (C) and limb blood flow and limb (D) were also significant, although not as strong as in the locomotor limbs.