
Figure 5. Limb vascular conductance, plasma ATP, blood oxyhaemoglobin and blood temperature .
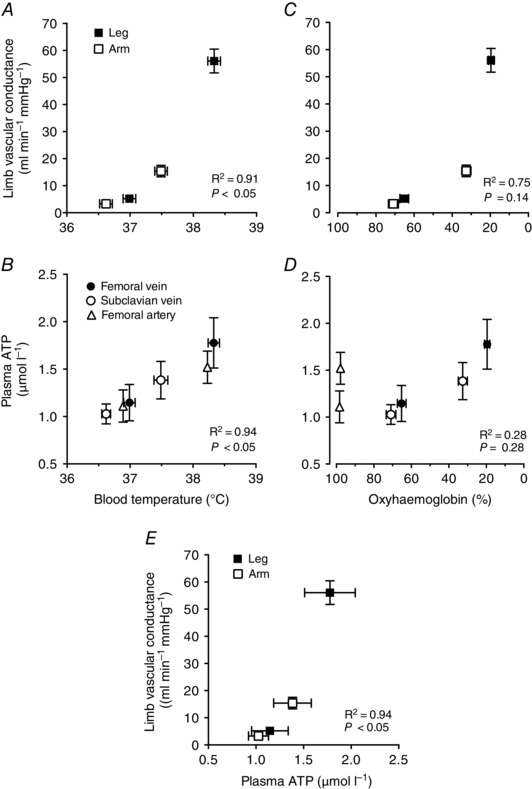
A–E, relationships between resting and steady‐state leg and arm exercise values for limb vascular conductance and plasma [ATP] plotted against blood temperature (T B) and blood oxyhaemoglobin as well as limb vascular conductance plotted against plasma [ATP]. The relationships amongst these variables were established using linear regression analysis. Data are means ± SEM for 15–16 participants. Note the significant correlation between limb vascular conductance versus T B (r 2 = 0.91; P < 0.05; A) and [ATP] (r 2 = 0.94; P < 0.05; E) and between [ATP] versus T B (r 2 = 0.99; P < 0.05; B). In contrast, the relationship between limb vascular conductance and venous and arterial blood oxyhaemoglobin was not significant (r 2 = 0.75; P = 0.14; C). The increase in venous [ATP] was correlated with reductions in venous blood oxyhaemoglobin (r 2 = 0.91; P < 0.05). However, [ATP] was also elevated during exercise in the arterial blood despite an unchanged arterial oxyhaemoglobin, making the overall correlational analysis of arterial and venous samples insignificant (D).