
Figure 6. Central and peripheral blood temperature and perfusion responses as a function of oxygen uptake during incremental leg exercise .
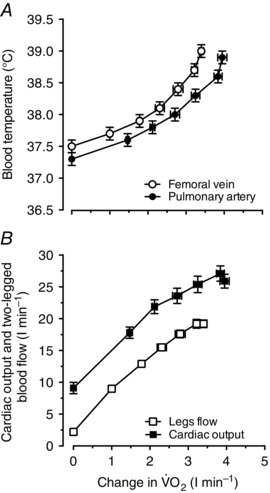
Relationship between blood temperature and perfusion versus aerobic metabolism during incremental leg cycling to volitional exhaustion. A, blood temperature in the femoral vein and pulmonary artery during incremental leg exercise plotted against increases in leg and systemic from baseline. B, cardiac output and two‐legged blood flow during incremental leg exercise plotted against increases in leg and systemic from baseline. Data are means ± SEM for 12 subjects. Note that mean T B values in the femoral vein and the pulmonary artery during the different stages of exercise were within ∼0.1°C.