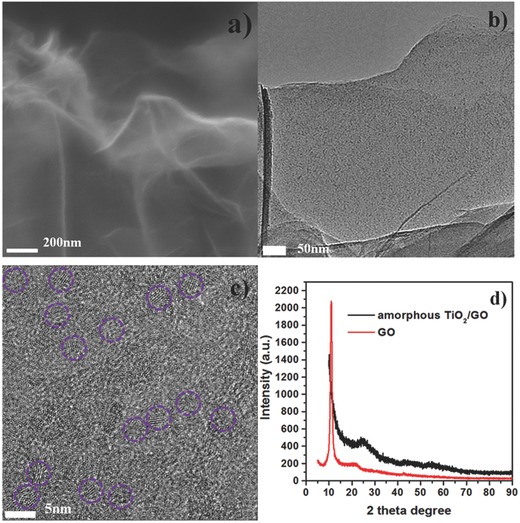
Figure 2.

a) FESEM image of amorphous TiO2/GO, bar 200 nm; b) TEM image of amorphous TiO2/GO, bar 50 nm; c) HRTEM image of amorphous TiO2/GO, where the partial crystallized domains are marked by purple circles, bar 5 nm; d) XRD patterns of GO powder and amorphous TiO2/GO composite.
