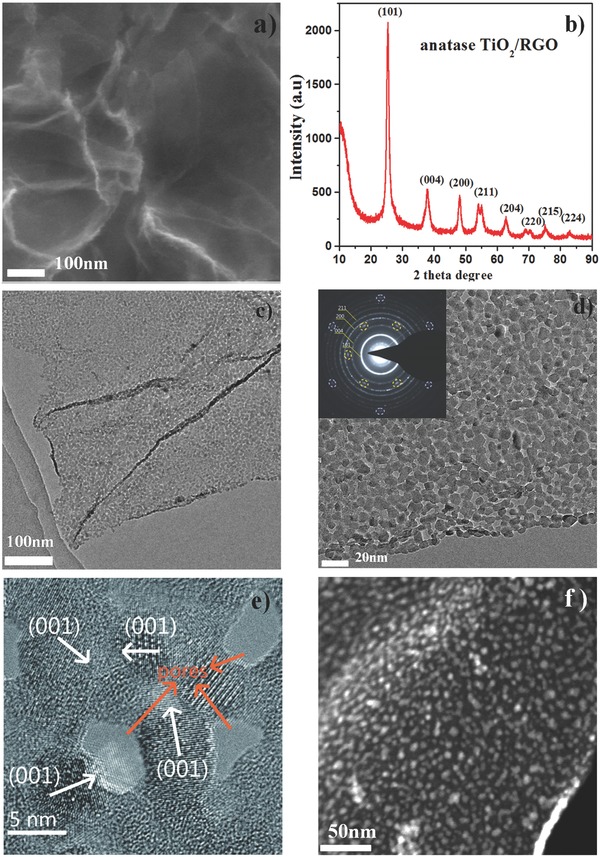
Figure 3.

a) FESEM image of anatase TiO2/RGO composite, bar 100 nm; b) XRD pattern of anatase TiO2/RGO composite; c,d) TEM image of anatase TiO2/RGO composite under different magnifications; inset: SAED of anatase TiO2/RGO composite, where the spot marked by the circle indicates the existence of RGO; e) HRTEM image of anatase TiO2/RGO composite, where the white arrows indicate the direction of (001) facets; the orange arrows indicate the existence of pores on the composite, bar 5 nm; f) STEM–HAADF image of anatase TiO2/RGO composites, where the strip‐shaped part highlighted in the lower‐right corner indicates the thickness of the anatase TiO2/RGO composite, bar 50 nm.
