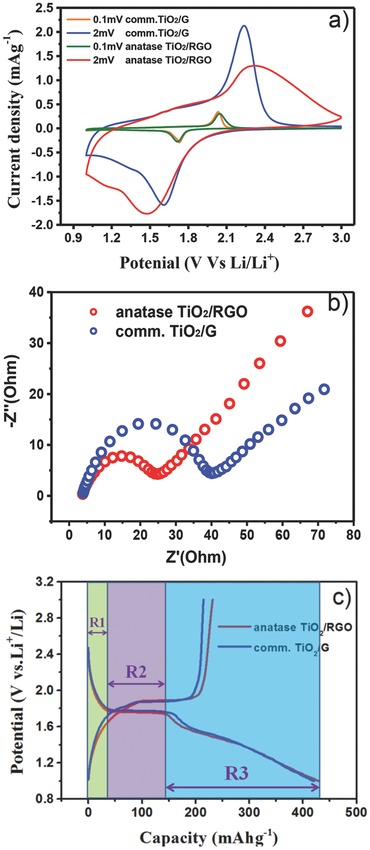
Figure 6.

a) CVs for anatase TiO2/RGO and comm.TiO2/G electrodes measured at a scan rate of 0.1 and 2 mV s−1, respectively. b) Nyquist plots for anatase TiO2/RGO and comm.TiO2/G. c) Initial galvanostatic discharge/charge curves for anatase TiO2/RGO and comm.TiO2/G electrodes at a rate of 0.2C in the potential window of 1.0–3.0 V; the R1, R2, and R3 regions indicated by the different colors show the capacities of the three regions, which are based on the initial discharge curve of anatase TiO2/RGO in Figure 6c.
