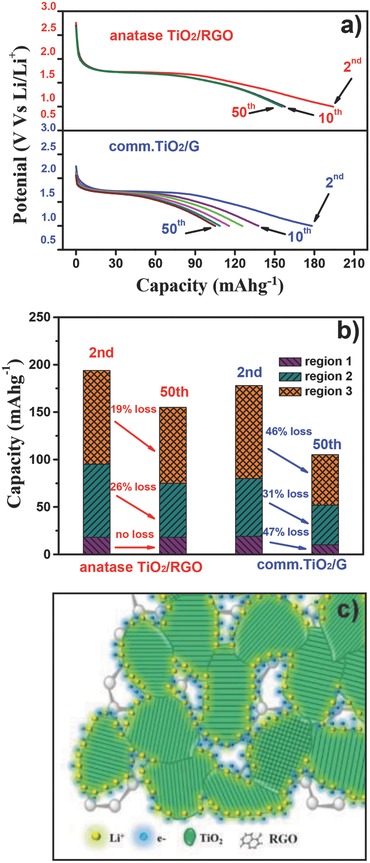
Figure 8.

a) The 2nd, 10th, 20th, 30th, 40th, and 50th discharge curves for anatase TiO2/RGO and comm.TiO2/G electrodes at the rate of 5C. b) The regions 1, 2, and 3 capacity contribution analysis of anatase TiO2/RGO and comm.TiO2/G electrodes at the 2nd and 50th discharge curves, respectively. c) Schematic representation of interfacial lithium storage on the anatase TiO2/RGO composites.
