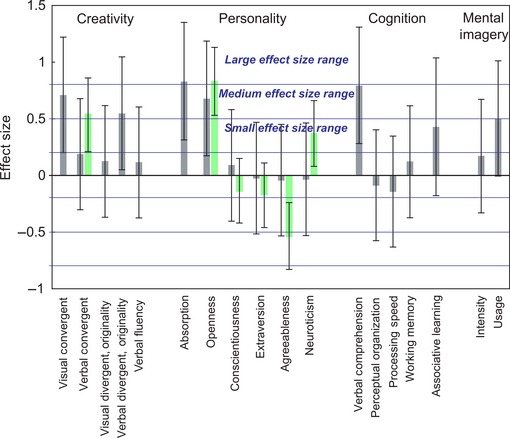
Figure 4.

Standardized effect sizes of creativity, personality, cognition, and mental imagery differences between all synesthetes and controls: comparison between the current study and previous studies. Gray bars = current study. Light green bars = previous study (Banissy et al., 2013 for personality; Ward et al., 2008 for creativity). Positive values indicate that synesthetes scored higher than non‐synesthetes. Negative values indicate that synesthetes scored lower than non‐synesthetes. The measure of effect size is Cohen's d. The point estimate of the effect size is the unbiased estimate (d unb). Effect sizes are considered as small for 0.2 < d < 0.5, medium for 0.5 < d < 0.8, and large for d > 0.8 (Cohen, 1988). Error bars represent 95% CIs on effect sizes.
