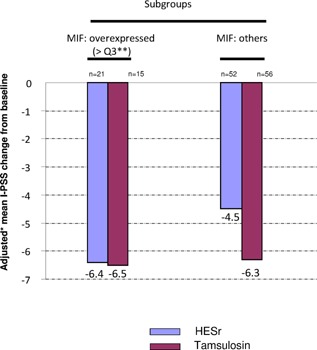
Figure 6.

I‐PSS adjusted* mean change from baseline to end of treatment (D90). In HESr group, response to I‐PSS at D90 was evaluated in patients who over expressed MIF protein at baseline (>3rd quartile) to those who did not over express this protein. * using Ancova model change=baseline+treatment. **>Q3 corresponds to the 25% of patients who expressed MIF at the highest level.
