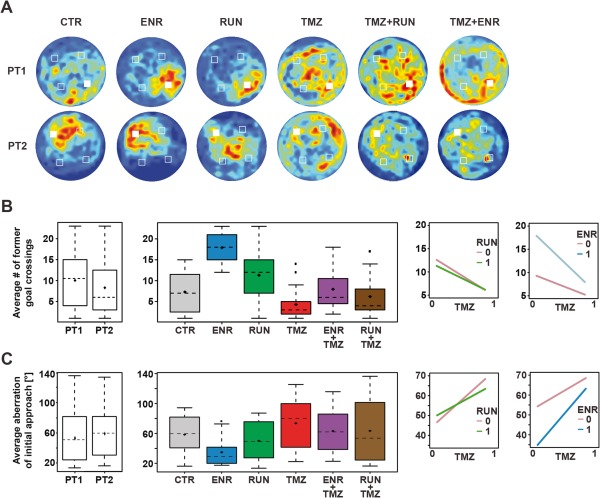
Figure 2.

Probe trial performance. (a) Probe trial performance indicated by heat maps. Dark‐red zones represent a sixfold presence probability. (b) Probe trial performance indicated by number of crossings of former goal positions. From left to right: comparison of the distribution of former goal crossings for probe trials 1 and 2; distributions of goal crossings in the experimental groups (pooled over both probe trials for reasons of simplicity. Since we found a significant effect of probe trial (P = 0.034) it was included in all ANOVA models used to analyze the effects of ENR, RUN, and TMZ); interaction plots illustrating the effect of TMZ on the different levels of RUN/ENR by connecting the corresponding mean values with straight lines. Boxplots are showing the median (dashed horizontal line), the interquartile range (whiskers), the mean (diamonds), and potential outliers (squares). (c) Average directional aberration of initial goal approach; see panel b) for description of plot parameters. [Color figure can be viewed in the online issue, which is available at wileyonlinelibrary.com.]
