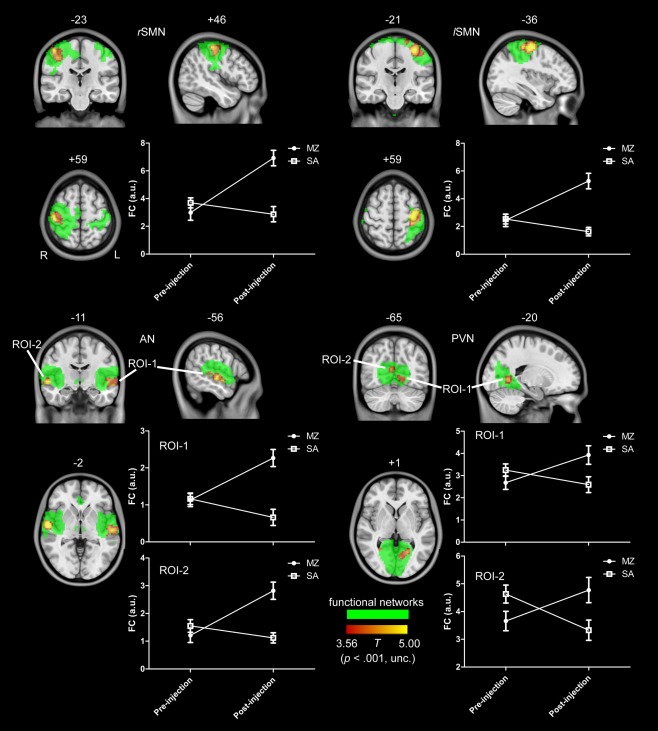
Figure 1.

The interaction effect for the lower level functional networks, including rSMN, lSMN, PVN, and AN. Voxels with significant differences are presented in hot, and rendered on the whole network distribution in green. Plots of the relative functional connectivity strength (z values) are shown for each cluster with significant interaction effect. [Color figure can be viewed in the online issue, which is available at http://wileyonlinelibrary.com.]
