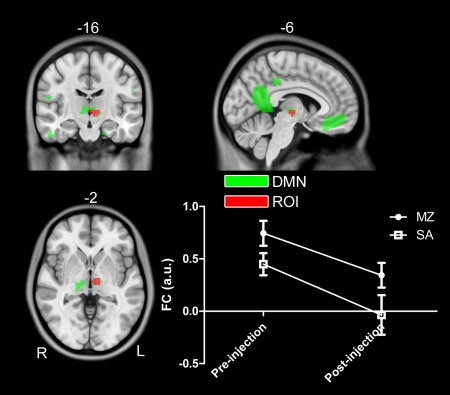
Figure 7.

A cluster in the left thalamus within DMN identified in the main effect of drug (i.e., (pre‐MZ + post‐MZ) vs. (pre‐SA + post‐SA)). Voxels with significant differences are presented in hot, and rendered on the whole network distribution in green. The relative functional connectivity strength (z values) of this region is plotted. [Color figure can be viewed in the online issue, which is available at http://wileyonlinelibrary.com.]
