Figure 1.

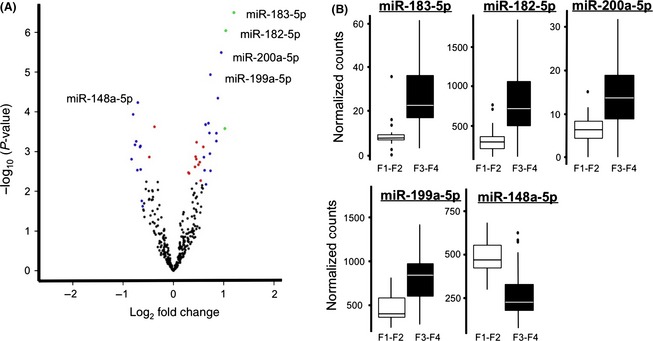
Assessment of microRNAs differentially expressed in liver samples. (A) A Volcano plot of samples from F1 and F2 (early) liver fibrosis compared with samples from F3 and F4 (advanced fibrosis). Log10 P‐value on the y‐axis and log2‐fold change on the x‐axis. microRNAs with a log2‐fold change >1 and significance <0.05 are indicated in green, microRNAs with fold change <−0.6 and >0.6 and adjusted P‐value <0.05 are blue, smaller fold changes with adjusted P‐value <0.05 are red. (B) Box and whisker plots for miR‐183‐5p, miR‐182‐5p, miR‐200a‐5p, and miR‐199a‐5p, the four microRNAs with the smallest P‐values and largest fold changes. We also included miR‐148a‐5p, the most significantly down‐regulated microRNA. The graph depicts the median and quartiles of the normalized counts for each group.
