
Figure 2.
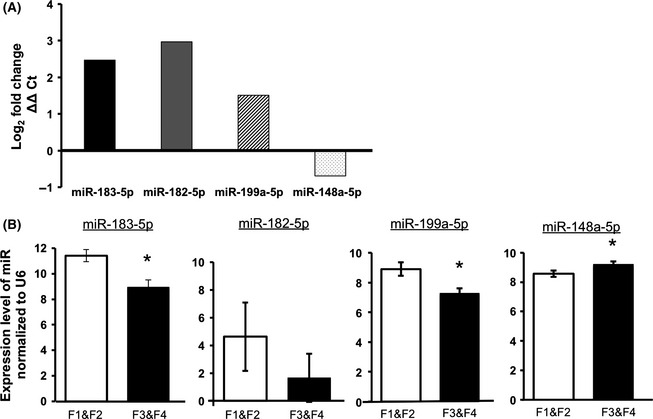
qRT‐PCR validation of four microRNAs with highest significance and fold change in comparison of F1 and F2 (early) with F3 and F4 (advanced) fibrosis. (A) Calculated fold change for microRNAs 183‐5p, 182‐5p, miR‐199a‐5p and miR‐148a‐5p. Fold changes were calculated using 2ΔΔCt. U6 was used for normalization in all samples. (B) Average Ct values normalized to U6 and the standard error of the mean. *indicates qRT‐PCR changes that are statistically significant by t‐test (P ≤ 0.05).