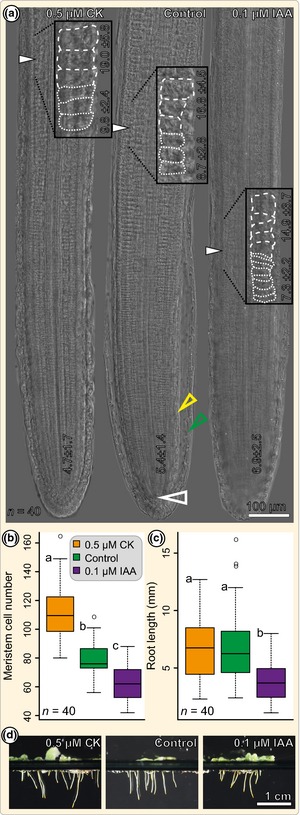
Figure 2.

Azolla root meristem cell number is elevated upon cytokinin and decreased upon auxin treatment. (a) Nomarski interference contrast micrographs of Azolla filiculoides roots treated with solvent (control), 0.5 μM trans‐zeatin (CK) and 0.1 μM IAA. Open arrows mark the root apical cell (RAC) and closed arrows mark the end of the outer cortex meristematic zone (MZ). Inserts show an enlarged view of the outer cortex transition zone (TZ), marking the end of the MZ and giving the average length of the last three cells of the MZ and the first three cells of the elongation zone (EZ) in µm (± SD; cells are retraced by dashed lines). Numbers at the apex give the average length of the first 10 outer cortex cells in μm (± SD). The green arrowhead marks the outer root cap, the yellow arrowhead marks the inner root cap. (b) Quantification of the outer cortex MZ cell number in mock (control)‐, 0.5 μM CK‐ and 0.1 μM IAA‐treated 3 d post‐cut (dpc) roots; significance groups a–c (P < 0.001) were determined using Mann‐Whitney U‐statistics. (c) Quantification of the root length in mock (control)‐, 0.5 μM CK‐ and 0.1 μM IAA‐treated 3 dpc roots; significance groups a and b (P < 0.001) were determined using Mann–Whitney U‐statistics. Box‐plots in (b) and (c) display the interquartile range (IQR; 50 ± 25%) of the data; horizontal lines in each box mark the median (50%), whiskers extend to the furthest data points within the 1.5 × IQR range, and circles mark outliers. (d) Photographs of 3 dpc A. filiculoides sporophytes in floating culture upon mock (control), 0.5 μM CK and 0.1 μM IAA treatment. All presented data points are derived from evaluation of at least 40 roots per treatment (n = 40).
