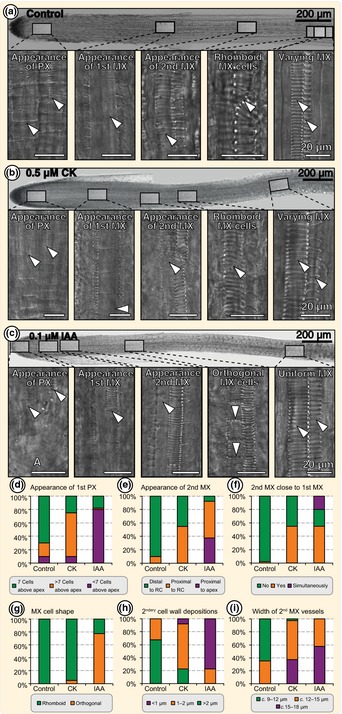
Figure 3.

Azolla root xylem development upon cytokinin and auxin treatments. (a–c) Nomarski interference contrast micrographs of Azolla filiculoides roots treated with solvent (control), 0.5 μM trans‐zeatin (CK) and 0.1 μM IAA; blow‐ups of marked positions along the root show details of the xylem phenotypes, marked with arrowheads. A, root apical cell; PX, protoxylem; MX, metaxylem. (d–i) Quantification of observed alterations in the xylem phenotype after control, 0.5 μM CK and 0.1 μM IAA treatment. Data points are derived from evaluation of at least 40 roots per experiment (n = 40). Root cap (RC).
