
Figure 5.
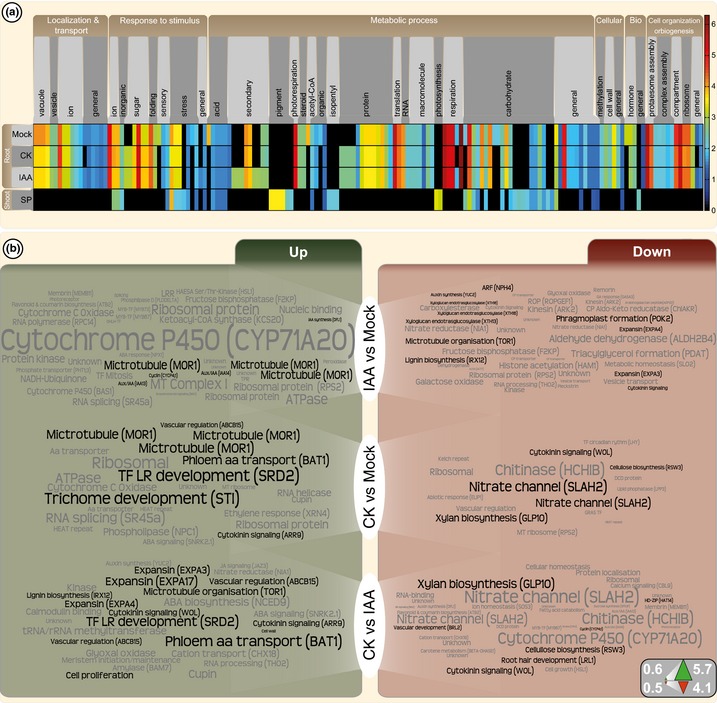
Gene expression changes in the Azolla root tip after auxin and cytokinin treatments. (a) Gene ontology (GO) enrichment analysis (P < 10−3) based on the Arabidopsis annotation (e‐value < 10−7) of the top 2000 expressed genes in 3 d post‐cut (dpc) roots 6 h after treatment with solvent (mock), 0.1 μM IAA and 0.5 μM trans‐zeatin (CK) and in the shoots. The fold enrichment of the GO terms is depicted as a colour gradient and GO terms were manually sorted into umbrella categories (top). (b) Significantly differentially regulated (P < 0.05) homologues (e‐value < 10−7) to Arabidopsis expressed in 0.3 mm of the root tip of Azolla filiculoides, represented as a word cloud. The bigger the word, the stronger the differential regulation comparing 0.1 μM IAA with mock (IAA vs mock), 0.5 μM CK with mock, and 0.5 μM CK with 0.1 μM IAA treatment. Words in black are of special interest with regard to the main text. Homologues are annotated based on A. thaliana; if applicable, the A. thaliana gene symbol is provided in brackets. Up‐regulated homologues are shown on the left, down‐regulated homologues on the right. Word sizes are based on log2(fold change); see the key in the right corner. For all individual values, see Supporting Information Table S6.