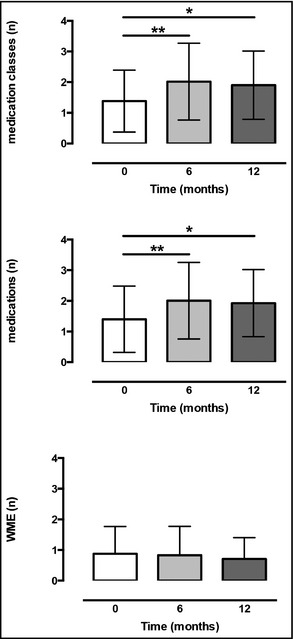
Figure 4.

Medication use at baseline and up to 12 months of follow‐up. Data are expressed as mean±standard deviation (n=55 at 0 and 6 months; n=41 at 12 months). Significance shown as *P<.05 and **P<.01 for Dunnett's post‐hoc test comparison to 0 months following one‐way analysis of variance. WME indicates whole medication equivalent.
