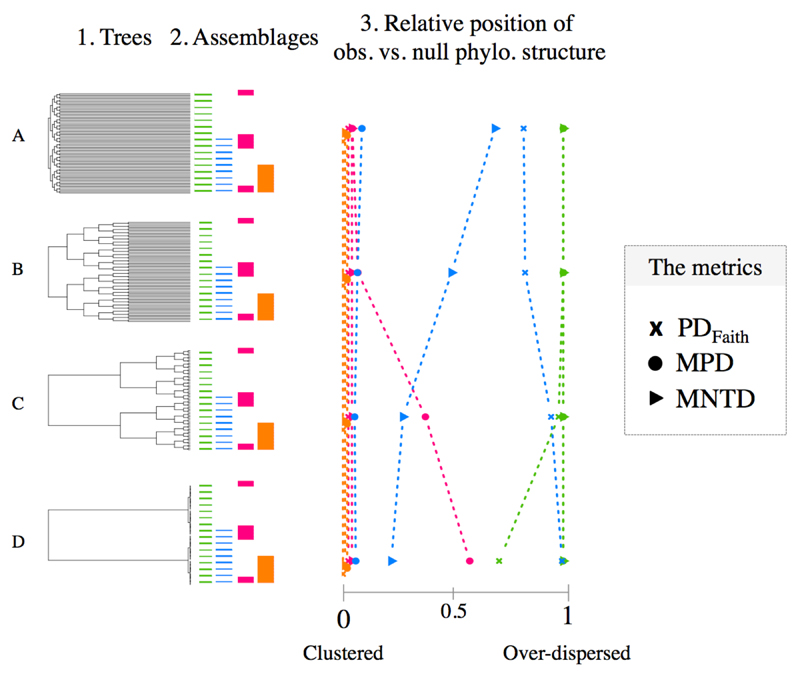
Figure 1. Sensitivity of PDFaith, MNTD and MPD to different assemblage structures and tree shapes.
The figure depicts four balanced trees (column ‘Tree’) along with four potential assemblage (column ‘Assemblage’): coloured segments indicate that the corresponding tips on the phylogeny are present in the assemblages (i.e. species presence); from left to right: simple simple overdispersion in green; clustering of overdispersion in blue; overdispersion of clusters in red; and simple clustering in orange. The corresponding diversities are presented in the third column. Values on the X-axis correspond to the relative position of observed value compared to a null distribution (interpreted as a p-value). For example, a value of 0 indicates that the observation is lower than all null expectations (‘clustering’) while a value of 0.5 indicates that the observation equals to the median of the null distribution. The different metrics are represented by different symbols (see legend).

