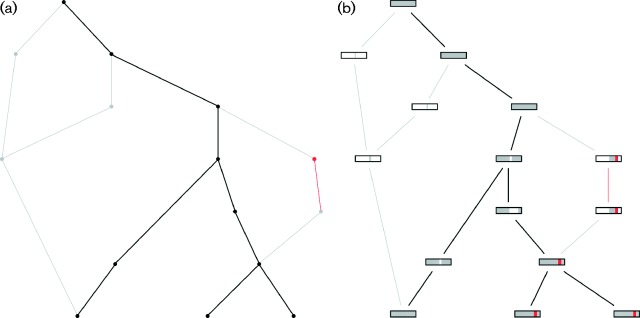
Fig. 2.
Examples of ancestral recombination graphs (ARGs) generated and plotted by SimBac. Branches represent ARG lineages, and time is considered to go backward from the bottom to the top of the tree. Branch merges (from bottom to top) represent coalescent events, while branch splits represent recombination events. (a) Example ARG with the clonal frame lineages marked in black, the non-clonal lineages in grey, and a recombination event involving an external species marked in red. (b) Same ARG as before, but with ancestral material of each lineage represented as a rectangle in the corresponding node. Each coloured vertical bar inside each rectangle represent a genomic segment. Genomic segments that are present in the ancestral material are coloured in grey, those absent are in white, and those imported from an external species are in red.

