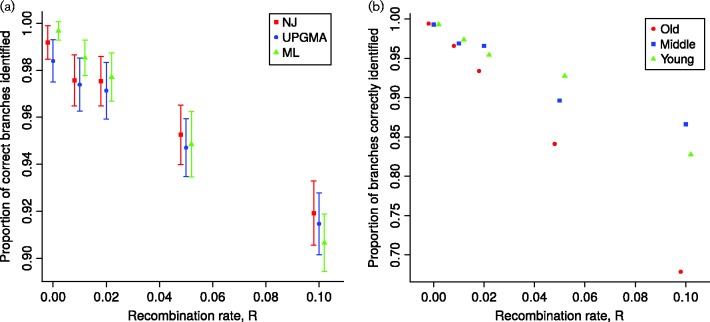
Fig. 3.
Accuracy of clonal frame estimation from recombining bacterial genomes. The x-axis shows the recombination rate R under which simulations are performed. The y-axis shows the accuracy of inference, as the proportion of branches correctly estimated using the Robinson–Foulds metric (Robinson & Foulds, 1981). Ten independent replicates are used for R = 0.1 and 100 in all other cases. Genomes are 1 Mbp long and the scaled mutation rate is fixed at 0.01. (a) Accuracy of three phylogenetic methods: neighbour-joining (NJ), unweighted pair group method with arithmetic mean (UPGMA) and maximum-likelihood (ML). Error bars represent ± 1 sd. (b) Clonal frame branches were separated into three age categories: young, middle-aged and old (respectively with a distance between the branch mid-point and the root of more than 2.09, between 1.32 and 2.09, and less than 1.32 Ne generations). The ML accuracy for each age category is plotted separately in different colours.

