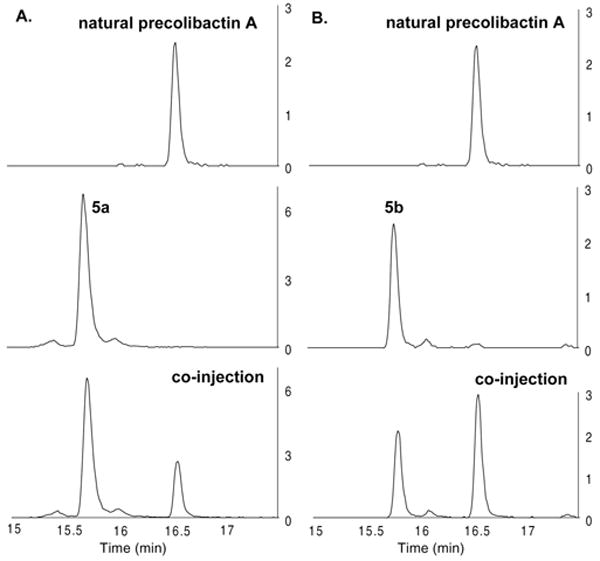
Figure 2.

(A) Mass-selective (m/z = 816.3788) LC/HRMS-QTOF analysis of the ethyl acetate extracts of clb+ E. coli ΔclbP (top), synthetic 5a (middle), and co-injection (bottom). (B) Mass-selective (m/z = 816.3788) LC/HRMS-QTOF analysis of the ethyl acetate extracts of clb+ E. coli ΔclbP (top), synthetic 5b (middle), and co-injection (bottom). The y axis corresponds to the relative ion intensity (×104).
