Fig. 1.
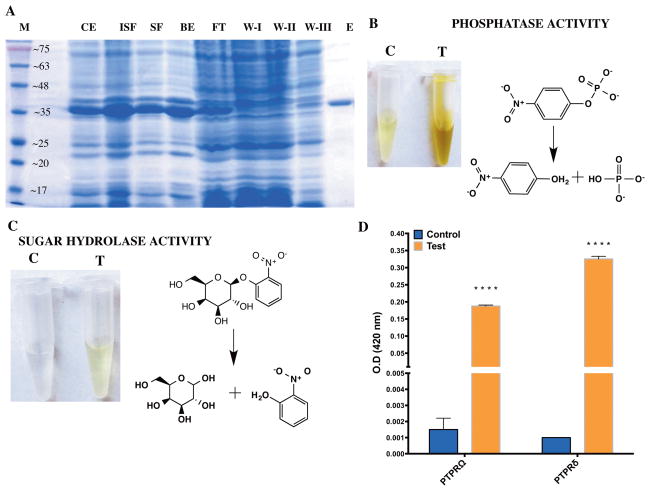
Protein purification and activity screen (A) Expression and purification profile of the phosphatase domain of Protein Tyrosine Phosphatae delta (PTPRδ). The protein was purified to homogeneity using IMAC purification. The gel image shows the systematic purification of the recombinantly expressed protein from proteins in the E. coli cell lysate. M: Molecular weight marker; CE: post-induction crude extract; ISF: in-soluble fraction; SF: soluble fraction; BE: Ni-NTA Beads; FT: Flow-through; W-I,II,III: Wash I, II and III, respectively. The numbers on the marker lane (M) indicates the molecular mass of the protein in KDa. (B) Assessment of phosphatase activity for the phosphatase domain of PTPRδ. The substrate employed is p-nitrophenyl phosphate and the reaction was allowed to proceed for 18 min at 37°C. (C) Assessment of sugar hydrolase activity for the phosphatase domain of PTPRδ. The substrate employed is o-nitrophenyl phosphate and the picture shows the reaction after 18 hours of incubation at 37°C. (D) hydrolysis of galactoside bond by PD-PTPRδ and PD-PTPRΩ as assessed on ONPG. Two way ANOVA was carried out to assess whether the difference was significant. A P-value of <0.0001 is represented by 4 “*” symbols. Notations “C” and “T” indicate control (without enzyme) and test (with enzyme), respectively and the reaction schemes were rendered with ChemBioDraw 14.0.

