Fig. 3.
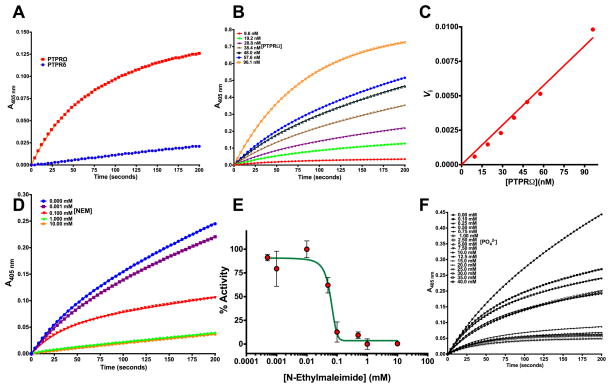
Hydrolysis of a phosphate substrate by PD-PTPRδ and PD-PTPRΩ (A) The time dependence of activity for PD-PTPRδ and PD-PTPRΩ. (B) Enzyme concentration dependence of the burst phase magnitude for PD-PTPRΩ as visualized on the time course measurement of substrate to product conversion. (C) Replot of data from (B) as a function of PD-PTPRΩ concentration. (D) Time course measurement of PD-PTPRΩ activity as a function of NEM concentration, an irreversible inhibitor, showing vanishing burst-phase. (E) Replot of % activity as a function of NEM concentration. (F) Time course measurement of PD-PTPRΩ activity as a function of phosphate concentration, a non-covalent reversible inhibitor, showing the retention of burst-phase. The symbols represent experimental data points, and the line represents the non-linear least squares fit. The Y-axis on panels (A, B, D and F) shows the optical density measurements estimated at 405 nm for the conversion of p-nitrophenyl phosphate to p-nitrophenol. The experimental data points were fit to the respective equations using the non-linear curve-fitting algorithm of GraphPad Prism v 6.0e or the software provided with Hitachi U-2010 UV-Vis spectrophotometer.

