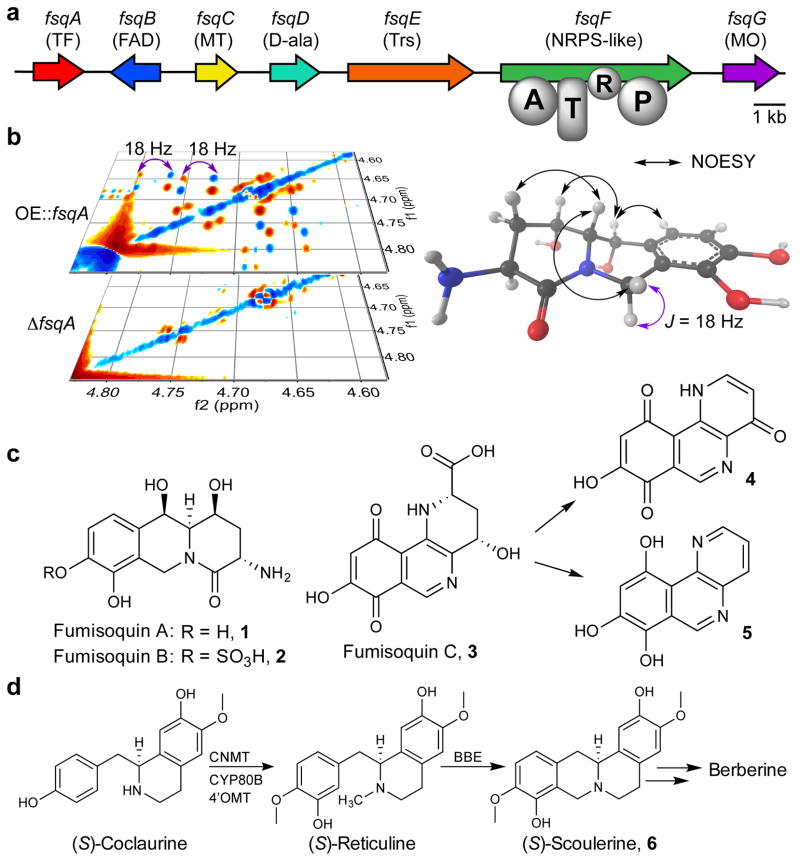
Figure 1. Analysis of the fsq gene cluster and metabolite production.
(a) fsq gene cluster and putative assignments of encoded proteins. TF: transcription factor; FAD: FAD-binding domain protein; MT: N-methyltransferase; D-ala: ATP-grasp enzyme (D-alanine ligase); Trs: transporter; NRPS: nonribosomal peptide synthetase (A = adenylation, T = thiolation, R = short-chain dehydrogenase/reductase domain, P: pyridoxal phosphate binding domain); MO: phenol 2-monooxygenase. (b) Section of the dqfCOSY spectra of OE::fsqA and ΔfsqA metabolite extracts used for comparative metabolomics (DANS). (c) Identified fsq-dependent compounds fumisoquin A and B (1 and 2), including stereochemical assignments via NOESY for 1 (see Supplementary Note), as well as structure of fumisoquin C (3), which decomposes to 4 and 5. (d) Biosynthesis of structurally related isoquinoline alkaloids in plants via coclaurine N-methyltransferase (CNMT), N-methylcoclaurine 3′-monooxygenase (CYP80B), 3′-hydroxy-N-methyl-(S)-coclaurine 4′-O-methyltransferase (4′OMT) and berberine bridge enzyme (BBE).

