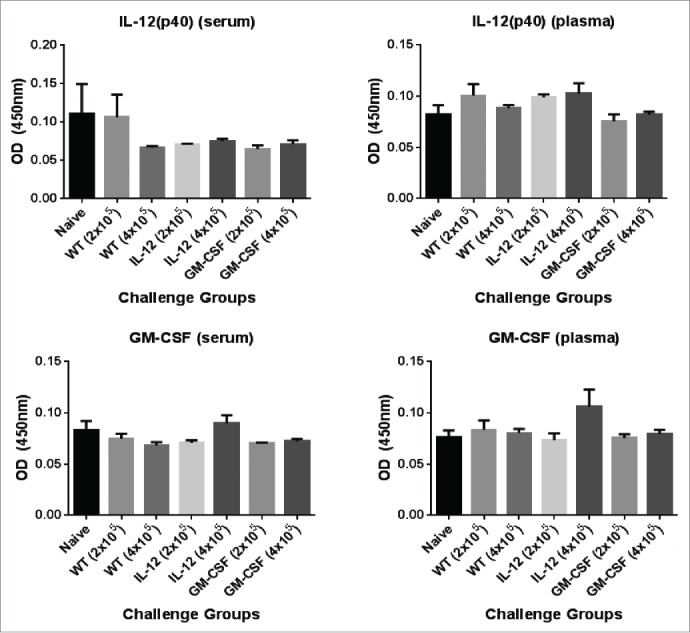
Figure 2.

Analysis of circulating levels of IL-12 and GM-CSF in mice challenged with D2F2/E2 cells expressing GPI-GM-CSF and GPI-IL-12. Serum and plasma was collected from mice 24hrs post challenge with 2 × 10⁵ or 4×10⁵ D2F2/E2 live cells adjuvanted with GPI-IL-12 or GPI-GM-CSF. Cytokine levels were quantified by a sandwich ELISA. Mean ± SEM is plotted (n = 3–5 mice/group).
