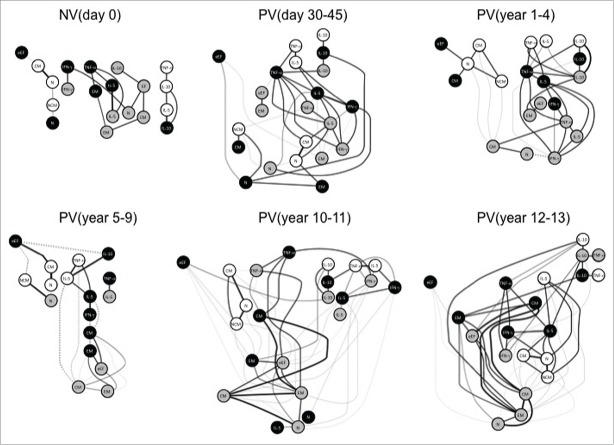
Figure 6.
Systems biology analysis of 17DD-YF primary vaccination over time. Networks were assembled by assessing the association memory and functional phenotypic subsets relevant to assessing the immune response after 17DD-YF primary vaccination at each time-point. Only significant positive and negative correlations (p < 0.05) are displayed. Continuous lines represent direct or positive correlations, whereas dotted lines represent inverse or negative correlations defined by spearman's correlation r index, as described in material and methods. The correlation index (r) defined the strength of association as moderate when 0.36 > r < 0.67 (thin lines) or strong if r > 0.68 (thick lines). Circles in gray, black and white refer to CD4+, CD8+ T-cells and B-cells, respectively. N – naïve, eEF – early effector, CM – Central Memory and EM – Effector Memory.

